
The complete BI blueprint for early-stage SaaS founders: From zero to data-driven decision making
My recommended data stack, implementation check-list, key business questions and much more.

👋 Hi there, I’m Justin. Welcome to another edition of SaaS Decoded. Each week, I publish an in depth, actionable guide to help SaaS founders and operators grow their businesses.
Hey friends,
In this week’s guide I’m going to be sharing my business intelligence blueprint for early-stage SaaS founders.
This blueprint is designed to help SaaS founders go from zero analytics and “gut-feel” decision making, to being able to answer key business questions quickly and accurately using their data.
In this post I’m going to be covering the following topics in detail:
The correct mindset early-stage founders need to have when it comes to BI.
The 6-step game plan to go from zero analytics to data-driven decision making.
The key business questions you need to answer using your data.
My recommended data stack for early stage SaaS businesses.
The importance of the “core funnel”.
Why you don’t need fancy, live dashboards and the report you DO need.
Who should own the analytics before and after you raise a Series-A.
And more.
Let’s jump in.
The first thing to get right is the mindset
In the early days of a SaaS business its all about survival while trying to reach product-market fit.
A SaaS business’s overall approach to business intelligence, or BI for short, needs to fit this reality.
The correct mindset for early stage founders to have when it comes to analytics, tracking, data collection and all the other areas of focus we could umbrella under BI is “lean, cheap and focused”.
Lean = A small number of tools, no dedicated human resources.
Cheap = Low cost.
Focused = The analytics serves the primary goals of the company. Only build what is needed. Focus on questions that need answering rather than metrics.
The game plan
Now that we’ve got the mindset down, it’s time to map out a game plan for using data to help us achieve our goals.
When it comes to setting up analytics for an early stage SaaS, the game plan can be summarized as follows:
“We need to take the steps needed so that we can quickly and accurately answer the most critical questions on our path towards the next step in our journey, improving our product-market fit and raising a Series-A round of funding.”
It all comes down to being able to answer key business questions.
In order to be in a position to answer these key questions, we need to work backwards from this end goal.
The game plan has the following steps:
Mapping out the key business questions
Implementing a modern data stack
Filling in the data gaps
Preparing the data warehouse
Build the core funnel report
Answer the key business questions
Game plan step #1: Mapping out the key business questions
There is a long list of questions that SaaS founders would love to be able to answer using their data but in the early days it’s critical to be focused.
Below is a list of the most important questions that SaaS founders need to be able to answer using their data.
These 4 questions will take up the majority of the business’s entire focus as it scales towards Series-A and beyond.
Key question #1: Do we have a healthy top-of-funnel?
In order to answer questions using data, we first need data. This is why this is the first question on our list.
Without a healthy top-of-funnel AKA enough weekly signups to our app, we won’t collect enough data and be able to answer the rest of our key questions.
So what would be considered a healthy top-of-funnel?
There’s no clear answer to this question but we can say the following with confidence:
A dozen signups a week isn’t enough.
A thousand signups a week is more than we need.
The correct answer for your business is somewhere in the middle of these two.
Ideally you’re signing up a few dozen to a few hundred signups every week.
That would give you enough “through-put in the system” to conduct cohort-based analysis with reasonably high statistical significance.
Key question #2: Do we have product-market fit?
Product-market fit is a complex topic that most founders don’t truly understand.
This topic was tackled in a very interesting way by Rand Fishkin in his post titled, Product-Market Fit is a Broken Concept. There’s a Better Way.
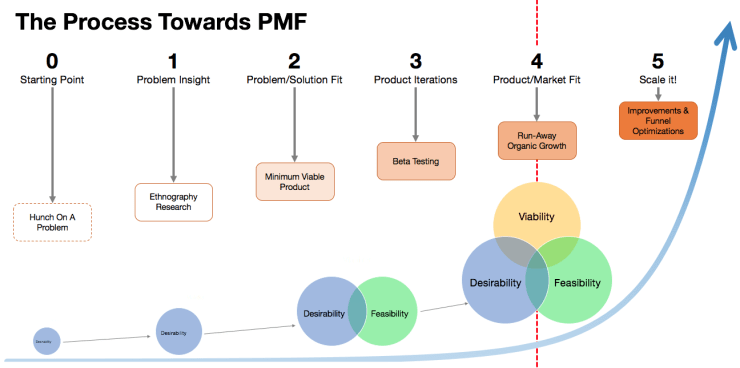
Rand argues that instead of looking at PMF as a binary yes, or no, it should be looked at on a spectrum.
So instead of asking, “do we have product-market fit”, instead a founder should ask, “how much product-market fit do we have among our user-base?”.
Another great resource on this topic is the video below by Rob Walling.
Key question #3: Where are the leaks in our core funnel?
To simplify things dramatically, I recommend SaaS founders focus on mapping and measuring their “core funnel”.
In the video below I introduce this topic and cover the steps in the core funnel.
SaaS founders need to know their “core funnel” numbers like the back of their hand and obsess over optimizing it, especially the initial steps of the funnel.
The core funnel will help you identify where you have “leaks” and where to focus your attention.
Key question #4: How are users actually getting value from our product?
Did you know Instagram didn’t start as a photo sharing app?
Instagram began as a location-based check-in app called Burbn. Only after analyzing what users were doing with the app did the founders, Kevin Systrom and Mike Krieger pivot and go all-in on photo sharing.
Only after analyzing usage and talking with users will you get the complete picture of how users see, and get value from your app.
This question is critical to answer in order to scale the business. You may have a number of assumptions on how the market is using and getting value from your app, and you might be completely wrong.
This will lead to bad decisions that could end up killing your company.
So now that you have mapped out your key questions, lets move onto the next step in the game plan, implementing a modern data stack.
Game plan step #2: Implement a modern data stack
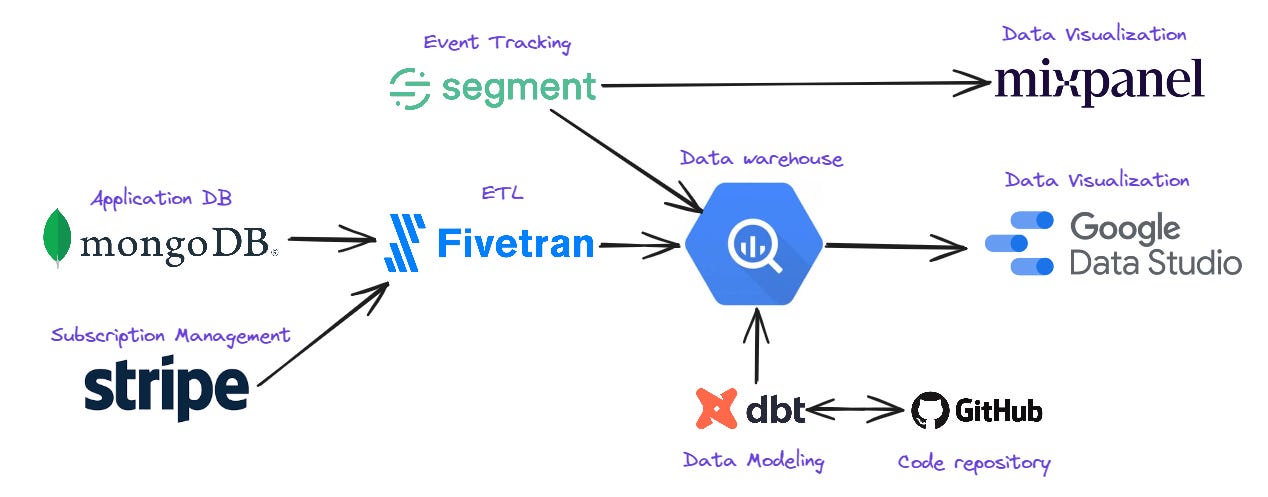
My recommended data stack for early-stage SaaS is made up of the following tools:
ETL - Fivetran
Data warehouse - Google BigQuery
Data modeling - dbt
Code repository - Github
Data visualization - Mixpanel and Google Data Studio (now named Looker Studio)
Event tracking - Segment
This stack aligns with your BI mindset, it’s lean, cheap and focused.
It’s also made up of best-in-class solutions which will scale well with your business as your data-needs grow.
This data stack allows you to leverage Mixpanel’s useful out-of-the-box reporting, while at the same time giving you the flexibility to build your own custom analyses and reports.
Let’s go through each piece of the stack.
The ETL solution - Fivetran
The first major piece of the data stack is our ETL solution, Fivetran.
ETL stands for extract, transform, load. The purpose of the ETL solution is to move data from silos, such as your application database, to a centralized data warehouse.
You want to put all you important data in the data warehouse so you can more easily blend data sources, and work efficiently with the data.
The two main data sources you want to centralize are the application database (information saved on the users that sign up to the service) and the subscription management solution.
Sources such as advertising platforms, email marketing solution etc aren’t a focus at this stage and can be analyzed manually in excel if needed.
Fivetran is a best-in-class ETL solution that connects with hundreds of data sources, including all the popular databases used to build SaaS applications.
The main issue with Fivetran is its pricing. At scale Fivetran is expensive.
The reason I still recommend it is because of its reliability, large number of supported sources and destinations, and world-class support. It also has a generous free plan which includes moving 500k rows of data per month at no cost.
Using an out-of-the-box ETL solution is far quicker than the alternative approach, building data pipelines yourself.
To keep costs down, only connect relevant tables / collections which you know will be used for analysis.
The data warehouse - Google BigQuery
I’m a big fan of Google BigQuery and have been using it for many years to support my consulting clients.
It takes just a few minutes to set up Google Cloud Platform where Google BigQuery is one of dozens of services.
I recommend Google BigQuery for the following reasons:
It’s very affordable.
Auto-scaling (no need for ongoing maintenance, dev ops).
Very well supported in the market.
Easy to set up.
Useful UI for users to work with the warehouse.
Multiple individuals can work with it in parallel without performance issues.
Data modeling - dbt
After Fivetran has loaded all the relevant business data into the data warehouse, you will want to turn that raw data into useful data models.
dbt is the most popular data modeling solution on the market.
It allows engineers and analysts that know SQL to quickly and easily turn raw data in the data warehouse into production-ready tables for reporting and analysis.
There is a bit of a learning curvey for dbt but a junior engineer or mid-level analyst with SQL experience should be able to master the initial data models with 15 - 30 hours of focused experience using dbt.
There are some great online courses and free YouTube tutorials that can be used to learn the basics of dbt.
Code repository - Github
Since dbt is a code-driven data modeling solution, it requires a place to save the code.
Github is the most popular code repository and version control solution on the market. It’s very affordable and your R&D team are probably already using it.
Each individual responsible for writing code in dbt will need access to the dbt Github repository.
Data visualization - Mixpanel & Google Data Studio (Looker Studio)
Mixpanel and Looker Studio are all you need in the early days for data visualization.

Mixpanel provides out-of-the-box reports on product usage, user engagement, and even retention by leveraging the event data you will send to Segment.
Mixpanel’s generous free plan makes it a very popular choice for early stage SaaS and there’s no reason not to include it in the stack.
Looker Studio can be connected to BigQuery and used to build reports. This will save a lot of time and make data and insights more accessible to more people on your team.
Both Mixpanel and Looker Studio are relatively easy to work with. If you need additional help, you can find a data visualization expert who knows these tools well on Upwork.
Event Tracking - Segment
The single biggest data gap that 90% of early-stage B2B SaaS have is user events.
Segment is the tool you will use to close this gap.

Segment is a robust product that serves multiple purposes. It’s considered a CDP (customer data platform).
To keep things simple and focused in this early stage, Segment should be seen solely as an event tracking solution.
Your developers will write code that will send data to Segment’s API and Segment will know how to take that data and send it through to 3rd party applications such as Mixpanel and your BigQuery data warehouse.
You will start by implementing 5 - 10 core events and scale this number over time.
How much will this data stack cost to run?
Below is a rough estimate of the costs to run my recommended data stack for a B2B SaaS that has a 500 - 1k monthly active users. Costs will be higher for B2C SaaS which typically have far more daily signups than B2B SaaS.
Fivetran - $0 to $500 a month
BigQuery - $0 to $50 a month
dbt - $100 a month (1 developer license)
Github - $8 a month (2 user licenses on the team plan)
Mixpanel - $0
Data Studio - $0
Segment - $0 (after 1k monthly active, will need to move to the business plan which is $120 a month)
So in total, the estimated price to run my recommended data stack is between $108 a month and $658 a month.
The variables which dictate how the total costs of the data stack scale are:
The average number of daily signups. More users create more data.
Which tables / collections you choose to sync to the data warehouse.
The frequency you decide to sync the data in Fivetran (I recommend no more than once a day in the early days).
The number of reports, and the frequency they are viewed in Google Data Studio.
The number of individuals, and the nature of their work in BigQuery. Two analysts running heavy queries will cost the business more money than one senior analyst running optimized queries.
The number of custom data models you’ve developed in dbt.
The frequency that dbt runs to build the custom models.
The overall volume of data stored in the data warehouse.
There are a lot of factors that go into setting up, optimizing and scaling a modern data stack.
The truth is that much of it isn’t important in the early days as the company works towards improving product-market fit.
Implementing the data stack - The check-list
There is a long list of tasks that need to be completed to implement the data stack shared above.
I’ve created a check-list which you can view here.

Game plan step #3: Filling in the data gaps
Now that your data stack is in place it’s time for R&D to get to work filling in the data gaps.
From my experience working with many SaaS businesses, the most common data gap is the lack of user-based event data.
To fill in this gap, one or more developers will need to write code that will send events to Segment so you can start tracking specific user actions.
This data can then be used to understand a) what users are doing, and b) if they are receiving value from the application.
To do this correctly you need to build a tracking plan that covers your core events.
Your tracking plan should list the following:
Event name - The name of the event.
Event properties - The properties you want to send with each event.
Trigger criteria - When exactly the event should be triggered.
Start with no more than 5 - 10 events and get them live in production ASAP so you can start collecting this important data.
Below is a list of the events you want to include in your initial batch. These events will become critical for building your core funnel report:
Signed Up —> When the user signed up to the application. We can track this “event” in the database but its still best practice to include it in the initial list of events.
Onboarding Completed —> If you have a complex onboarding process it’s a good idea to include an event which indicates that the user got to the end of that process. We can use this event to determine the percentage of users that completed the onboarding. If you don’t have an onboarding phase, you can skip this event.
Wow moment reached → This one is tricky and will be different for every SaaS business. It’s an event which indicates that the user experienced value from the app. It’s the moment when the user would say, “wow, this is cool”. This event could also be the moment a key feature is used.
Subscription Created —> The moment a user upgrades from a free user to a paid user. If you opt free users into a paid plan without requiring a credit card, then I recommend adding an additional event, Payment Method Added, or something along those lines. There needs to be some friction in this step. This event will be used to see the percentage of users that are ready to pay for your software.
Charge Processed Successfully → The moment the paid subscriber is actually charged. It’s not enough for us to just track when users create subscriptions. What we really care about are paying users. This event also allows us to track recurring payments which we can use for analyzing revenue retention. This event is also important if you have a free trial. We know the trial ended successfully when we receive a charge.
Subscription Canceled —> The moment a user cancels their subscription. This is the end of the user’s lifecycle. It is important to track this event for measuring and analyzing churn.
Once R&D have finished programming these events and they are being sent to Segment, we can move onto the next step, preparing the data warehouse.
Game plan step #4: Preparing the data warehouse
At this point you should be sending a number of useful events to Segment. These events should be “forwarded” to 2 destinations, Mixpanel and your data warehouse, BigQuery.
The next step in the process is to take the raw data you have in your data warehouse and develop useful data models which can be used for answering your key business questions. You will use dbt to create these models.
To be clear, at this point your goal isn’t to develop a fully functioning data warehouse which can support multiple departments and stakeholders. You are focusing on building the underlying infrastructure to answer the key business questions you mapped out in step #1 in the game plan process.
The good news is that you only need 1 custom-built, production-ready data model to answer 3 out of 4 of the key business questions. You can call this model, the “core funnel” model.
The core funnel data model should have the following fields:
user_id: The internal id of the user in your database.
created_at: The timestamp when the user was created. This field will be used for segmenting users into cohorts.
onboarding_completed_at: The timestamp of the onboarding completed at event.
first_wow_moment_reached_at: The timestamp of the first time the user experiences your wow moment.
first_subscription_created_at: The timestamp of the first subscription created by the user.
first_successful_charge_processed_at: The timestamp of the first successful transaction belonging to the user.
first_subscription_canceled_at: The timestamp of the first time the user canceled their subscription.
You can also add any useful descriptive fields you want to the model to allow you to filter / segment the data. An example might be company size (assuming you collected that field during the onboarding phase).
In order to build this table you’ll need to start with the users table and left join certain events from the Segment events table, and from your subscription management solution tables.
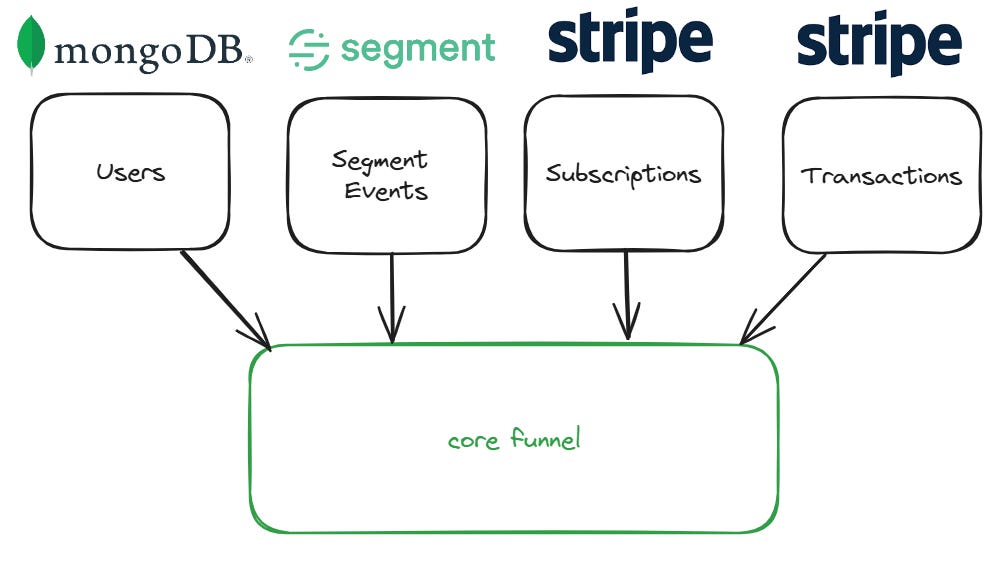
Notice your core funnel data model is made up of data from 3 sources, your application database (I’ve used a MongoDB in my example), Segment, and your subscription management solution (I’ve used Stripe in my example).
Game plan step #5: Build your core funnel report
Once you’ve developed the “core funnel” data model in your data warehouse, you will be ready to build out a core funnel report.
In the video below I show the report in a Tableau dashboard but you could build the same report in Google Data Studio or even with some manual work in Excel.
When building your core funnel report, you will want to do a distinct count of users in each step in the funnel.
To achieve this, you may need to use IF/ELSE logic wherever you are building the report.
For example, to count the users that completed your onboarding flow, you might need to us “count distinct (IF onboarding_completed_at IS NOT NULL THEN user_id ELSE NULL)”.
This logic would return the user_id of the user if the user has a value for when he completed onboarding. You’d then do a distinct count of these user_ids to know how many users got to that step in the funnel.
The reason I’m a fan of the core funnel report is that it can be used to answer 3 out of the 4 key business questions.
Do we have a healthy top-of-funnel? ✔️
Do we have product-market fit? ✔️
Where are the leaks in our core funnel? ✔️
How are users actually getting value from our product? ❌
Let’s see how.
Game plan step #6: Answer the key business questions
The final step in the game plan is to answer the key business questions.
Let’s go through each question.
Key question #1: Do we have a healthy top-of-funnel?
You can answer this question by looking at the number of signups in each weekly cohort in your core funnel report.
The smaller the number, the harder its going to be to judge the performance of the cohort, and if the product is succeeding in moving users down the funnel.
Ideally you have a few hundred signups each week consistently so you can consider this question answered, and you can move onto the next question.
Key question #2: Do we have product-market fit?
Remember, this question doesn’t have a binary answer.
What you hope to see is a percentage of your users becoming paid subscribers, even if its a very low percentage (1%).
This is a positive sign that you have some level of product-market fit (“some percentage of people that experience our product are willing to pay for it”.)
You can then isolate those paying users and try and see what makes them different. You may find that the 1% that pay you are very different than the other 99% that have signed up.
Key question #3: Where are the leaks in our core funnel?
As long as you are showing the conversion rate between each step in the funnel, you’ll be able to quickly see where there are “leaks” in your core funnel.
There are certain “leaks” which can to be expected.
Most SaaS have a relatively low conversion to paid so expect a large percentage of users to never become paid subscribers.
You can also expect 10 - 30% of users to never complete the onboarding phase, depending on the nature of your app, the quality of your onboarding experience, and the market you are targeting.
You will also most likely have a high churn rate (% of subscribers that cancel) in the beginning of your journey as you work on improving your product and provide more value to users.
Key question #4: How are users actually getting value from our product?
Answering this question will take some work since it can’t be answered using the core funnel report.
The way you answer this question is by analyzing how users use your product, and by talking with them.
You should aim to talk with as many users you can to find out how users perceive, use, and describe your product.
Look for patterns in the answers users provide and come with no expectations. Have an open mind.
You can use Mixpanel to answer basic usage, retention and activation questions and to see which events users are triggering and when. This can lead to some interesting questions you can ask specific users when you talk with them.
Tools such as Intercom, and Customer.io can be used to automate data collection and setting up video calls with targeted users. Intercom + Calendly is a powerful combination.
Final thoughts
Congratulations, you’ve implemented a modern data stack that has helped you answer some key business questions.
You can now scale the infrastructure to answer more questions and use your data to guide your roadmaps. You’ll also be much better prepared to answer questions sent your way from VCs when you start your next funding round.
Before I end this guide I want to answer some lingering questions you might have at this point.
Who exactly in the organization should implement the game plan you shared aboved? Who should be responsible after we raise our Series-A?
I believe the CEO or COO should be responsible for business intelligence in a SaaS business, both before and after the business raises a Series-A round.
Before the Series-A, when the team is small, the CEO or COO may need to do the implementation (setting up the tools, working with R&D to send events etc) him or herself since there isn’t anyone else that can do it.
After the Series-A round has been raised, its a good time to either hire a head of data, or delegate the responsibilities to someone competent on the team.
What if we are pre-revenue? How can we use our data to understand if we have product-market fit?
If your product is completely free (not something I’d recommend by the way) and you want to know if you have some form of product-market fit then you need to look more closely at retention.
The core funnel report should still be built so you can see “leaks” in your core funnel, but what you want to look for in addition to a healthy funnel, is high, repeat usage.
The best proxy for product-market fit if you don’t have paid memberships, is high usage. The assumption is that if you see high usage among a segment of your users, at least some of those users would pay you to be able to continue using the product.
My advice would be to launch with a paid plan on day 1.
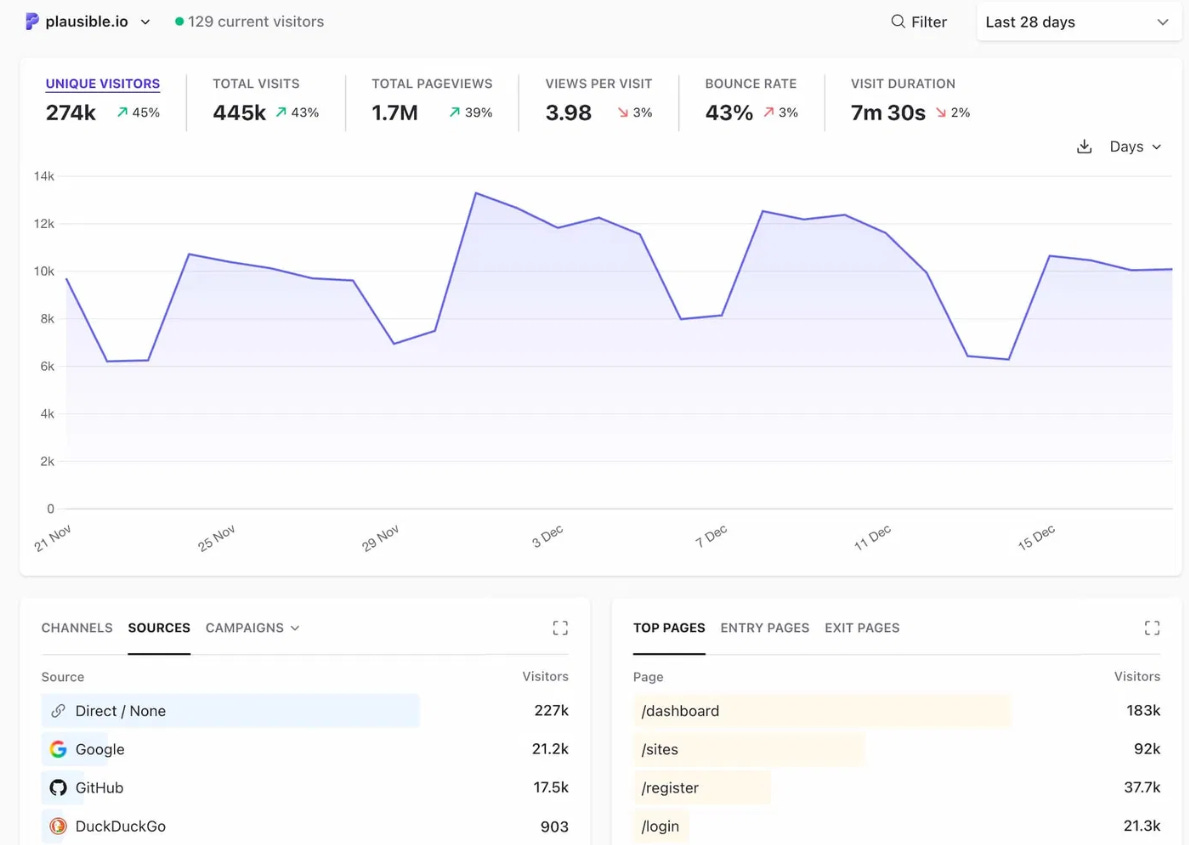
What about Google analytics and tracking website traffic?
I think its a good idea to keep an eye on website traffic since this does connect with one of the key business questions, “do we have a healthy top-of-funnel?”.
Without traffic you won’t have signups.
Unfortunately Google Analytics 4 is a disaster and quite difficult to use effectively. A good alternative I can recommend is Plausible. It’s a simple web traffic reporting and analysis tool that “just works”.
I run an enterprise B2B SaaS, is this guide still relevant for my business?
There are parts of this guide which are definitely relevant for enterprise B2B SaaS, for example the sections covering my recommended data stack.
The main challenge early-stage enterprise B2B SaaS will have when it comes to BI is the lack of data.
Since the number of accounts signing up will be very small, there’s no way to get statistical significance on key metric.
A lot more “gut-feel” and qualitative data is leveraged to gauge if the business is on the right track.
The game is more about getting high usage and adoption among the businesses that have engaged with the SaaS, rather than incremental gains across a large sample size of accounts.
I have money in the bank and would prefer to pay an expert to help us implement a modern data stack and answer our key business questions instead of doing it ourselves. Do you have someone you can recommend to help us?
Yes I do. I’m close with a number of SaaS-focused BI service providers that could help you out.
Reach out to me in a DM either on LinkedIn, X or on Substack and I’ll see how I can help.
Thanks for reading this weeks post.
If you’re finding this newsletter valuable, share it with a friend, and consider subscribing if you haven’t already.
Best,
Justin